Metascape Gene List Analysis Report
metascape.org1
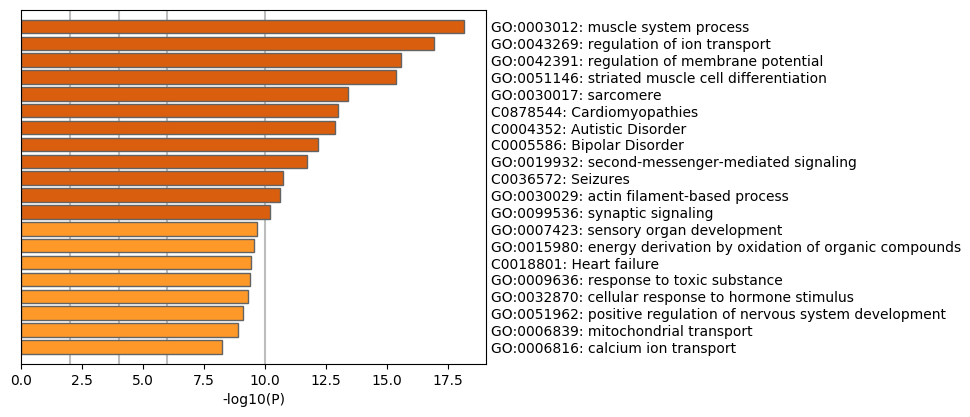
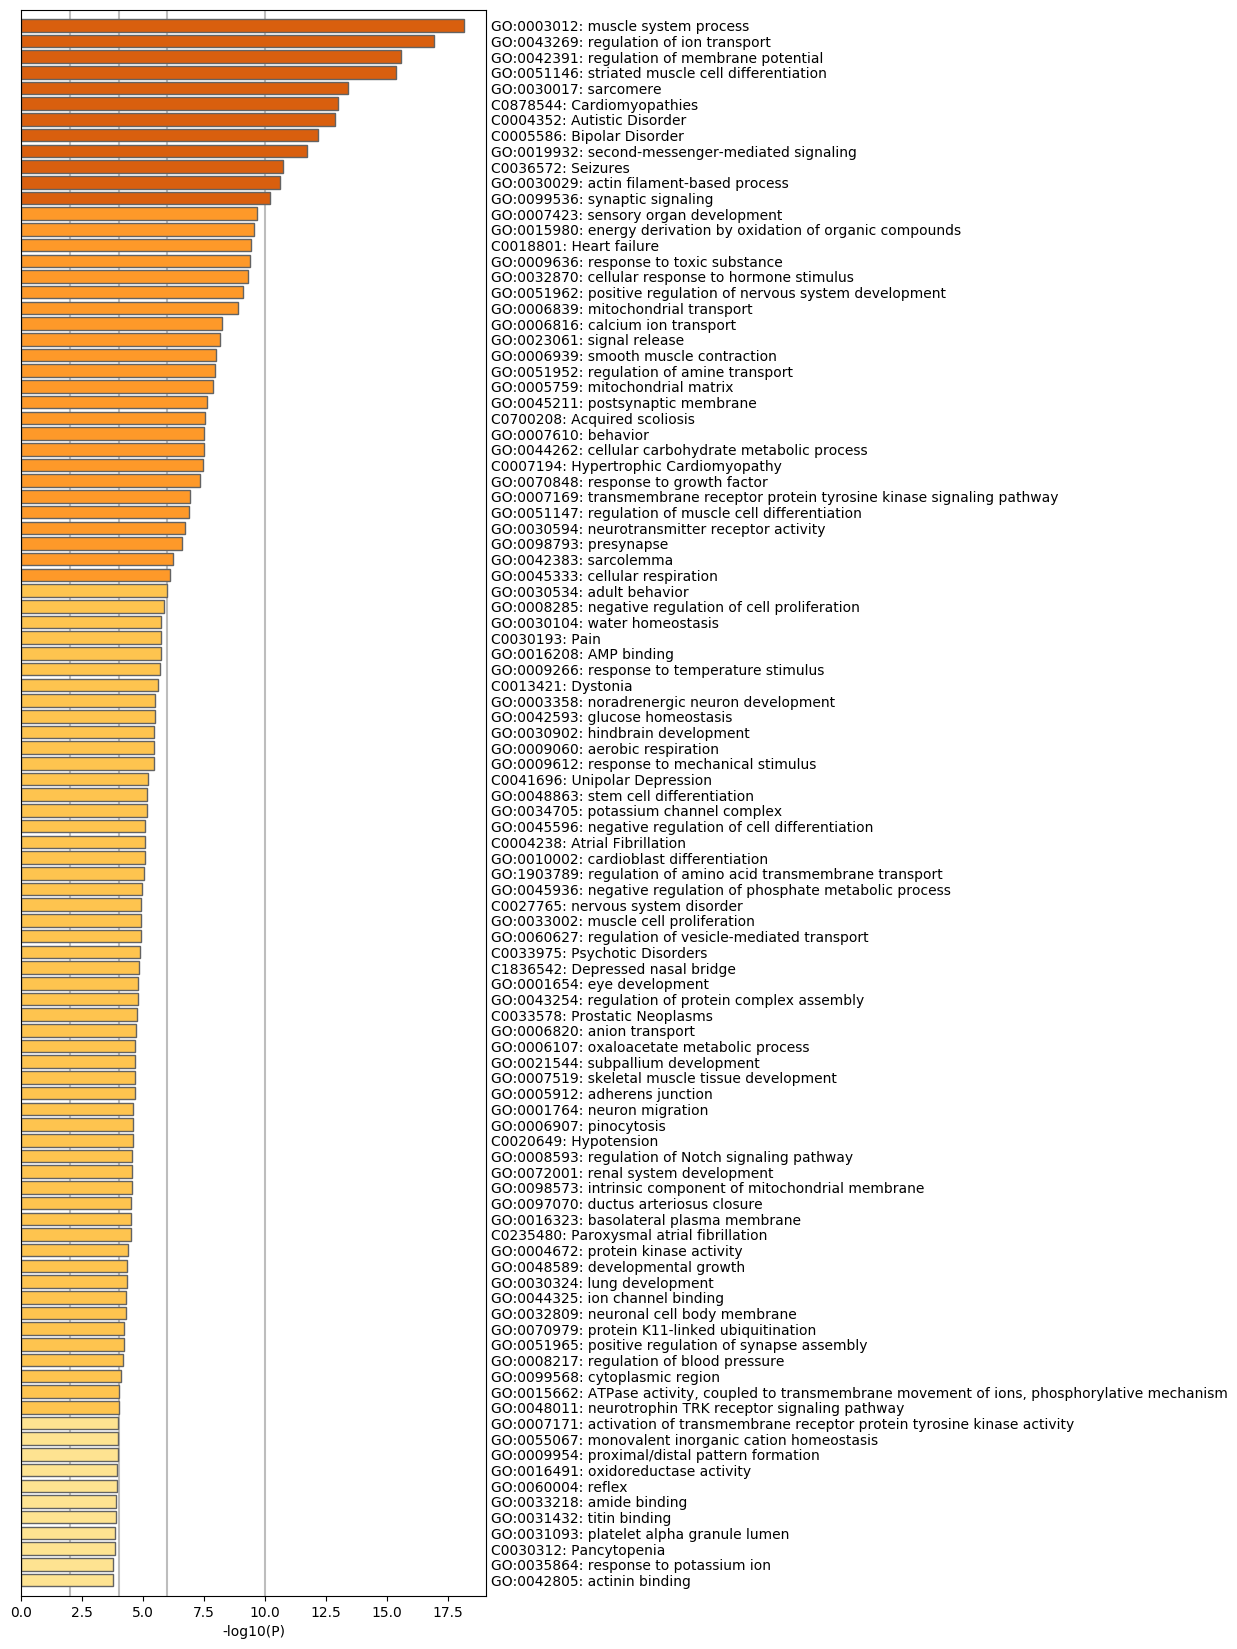
Bar Graph Summary
Gene Lists
User-provided gene identifiers are first converted into their corresponding H. sapiens Entrez gene IDs using the latest version of the database (last updated on 2020-03-19). If multiple identifiers correspond to the same Entrez gene ID, they will be considered as a single Entrez gene ID in downstream analyses. The gene lists are summarized in Table 1.
Table 1. Statistics of input gene lists.
| Name |
Total |
Unique |
| Input ID |
482 |
482 |
Gene Annotation
The following are the list of annotations retrieved from the latest version of the database (last updated on 2020-03-19) (Table 2).
Table 2. Gene annotations extracted
| Name |
Type |
Description |
| Gene Symbol |
Description |
Primary HUGO gene symbol. |
| Description |
Description |
Short description. |
| Gene Summary |
Description |
A paragraph summarizing gene function. |
Pathway and Process Enrichment Analysis
For each given gene list, pathway and process enrichment analysis has been carried out with the following ontology sources: GO Biological Processes, GO Cellular Components, GO Molecular Functions, TRRUST and DisGeNET. All genes in the genome have been used as the enrichment background. Terms with a p-value < 0.01, a minimum count of 3, and an enrichment factor > 1.5 (the enrichment factor is the ratio between the observed counts and the counts expected by chance) are collected and grouped into clusters based on their membership similarities. More specifically, p-values are calculated based on the accumulative hypergeometric distribution
2, and q-values are calculated using the Banjamini-Hochberg procedure to account for multiple testings
3. Kappa scores
4 are used as the similarity metric when performing hierachical clustering on the enriched terms, and sub-trees with a similarity of > 0.3 are considered a cluster. The most statistically significant term within a cluster is chosen to represent the cluster.
Table 3. Top 20 clusters with their representative enriched terms (one per cluster). "Count" is the number of genes in the user-provided lists with membership in the given ontology term. "%" is the percentage of all of the user-provided genes that are found in the given ontology term (only input genes with at least one ontology term annotation are included in the calculation). "Log10(P)" is the p-value in log base 10. "Log10(q)" is the multi-test adjusted p-value in log base 10.
| GO |
Category |
Description |
Count |
% |
Log10(P) |
Log10(q) |
| GO:0003012 |
GO Biological Processes |
muscle system process |
29 |
16.38 |
-18.15 |
-13.59 |
| GO:0043269 |
GO Biological Processes |
regulation of ion transport |
33 |
18.64 |
-16.92 |
-12.66 |
| GO:0042391 |
GO Biological Processes |
regulation of membrane potential |
26 |
14.69 |
-15.57 |
-11.61 |
| GO:0051146 |
GO Biological Processes |
striated muscle cell differentiation |
22 |
12.43 |
-15.35 |
-11.49 |
| GO:0030017 |
GO Cellular Components |
sarcomere |
23 |
6.52 |
-13.41 |
-10.02 |
| C0878544 |
DisGeNET |
Cardiomyopathies |
14 |
7.91 |
-13.01 |
-9.75 |
| C0004352 |
DisGeNET |
Autistic Disorder |
26 |
7.37 |
-12.86 |
-9.70 |
| C0005586 |
DisGeNET |
Bipolar Disorder |
24 |
13.56 |
-12.18 |
-9.14 |
| GO:0019932 |
GO Biological Processes |
second-messenger-mediated signaling |
22 |
12.43 |
-11.71 |
-8.82 |
| C0036572 |
DisGeNET |
Seizures |
24 |
13.56 |
-10.76 |
-8.00 |
| GO:0030029 |
GO Biological Processes |
actin filament-based process |
27 |
15.25 |
-10.62 |
-7.89 |
| GO:0099536 |
GO Biological Processes |
synaptic signaling |
37 |
10.48 |
-10.19 |
-7.53 |
| GO:0007423 |
GO Biological Processes |
sensory organ development |
31 |
8.78 |
-9.69 |
-7.10 |
| GO:0015980 |
GO Biological Processes |
energy derivation by oxidation of organic compounds |
16 |
9.04 |
-9.56 |
-7.00 |
| C0018801 |
DisGeNET |
Heart failure |
13 |
7.34 |
-9.42 |
-6.88 |
| GO:0009636 |
GO Biological Processes |
response to toxic substance |
21 |
11.86 |
-9.37 |
-6.86 |
| GO:0032870 |
GO Biological Processes |
cellular response to hormone stimulus |
24 |
13.56 |
-9.29 |
-6.79 |
| GO:0051962 |
GO Biological Processes |
positive regulation of nervous system development |
30 |
8.50 |
-9.09 |
-6.61 |
| GO:0006839 |
GO Biological Processes |
mitochondrial transport |
15 |
8.47 |
-8.90 |
-6.44 |
| GO:0006816 |
GO Biological Processes |
calcium ion transport |
18 |
10.17 |
-8.25 |
-5.89 |
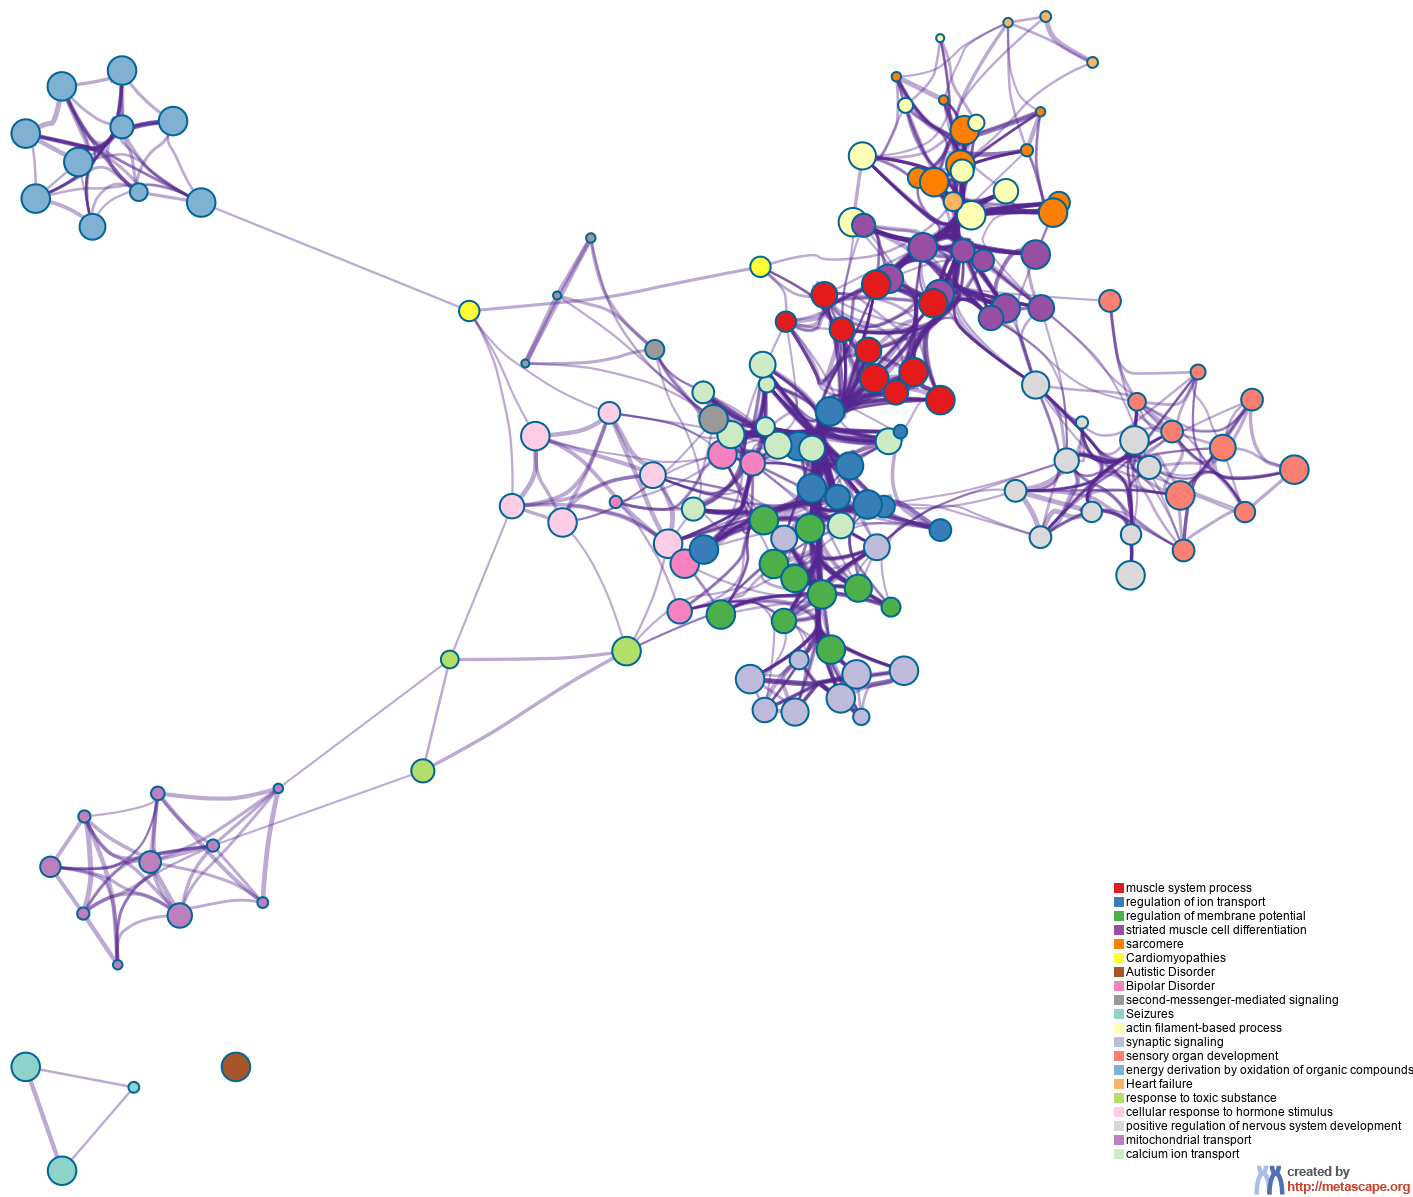
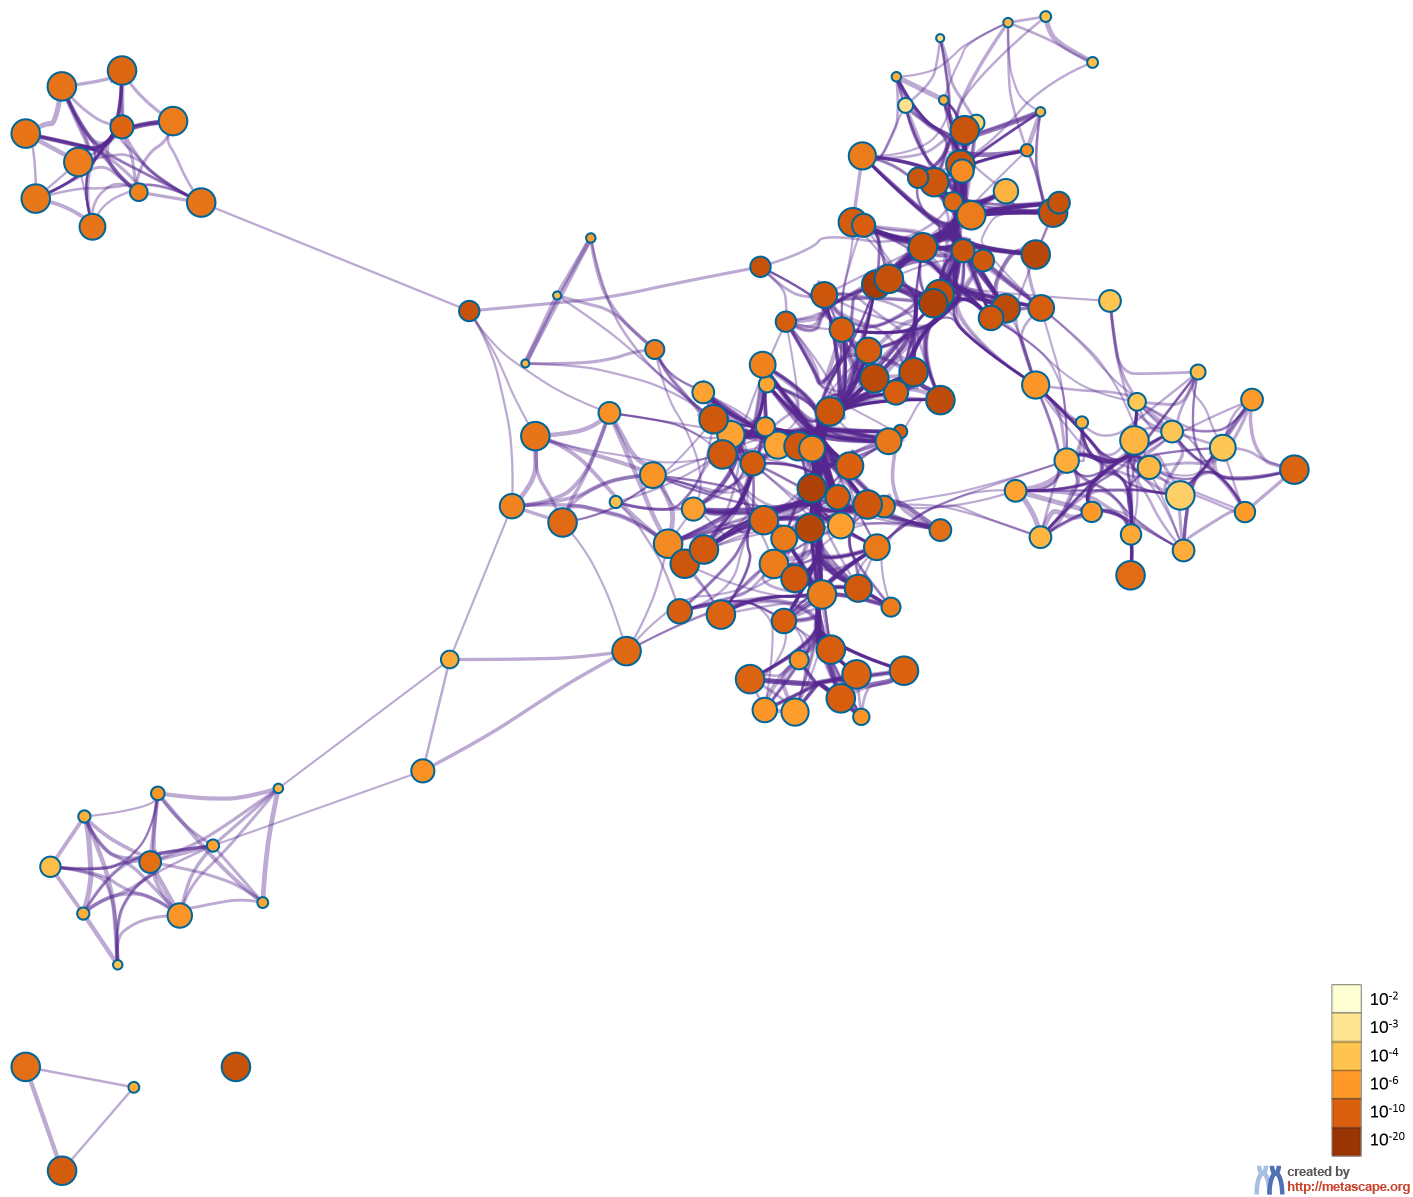
To further capture the relationships between the terms, a subset of enriched terms have been selected and rendered as a network plot, where terms with a similarity > 0.3 are connected by edges. We select the terms with the best p-values from each of the 20 clusters, with the constraint that there are no more than 15 terms per cluster and no more than 250 terms in total. The network is visualized using
Cytoscape5, where each node represents an enriched term and is colored first by its cluster ID (Figure 2.a) and then by its p-value (Figure 2.b). These networks can be interactively viewed in Cytoscape through the .cys files (contained in the Zip package, which also contains a publication-quality version as a PDF) or within a browser by clicking on the web icon. For clarity, term labels are only shown for one term per cluster, so it is recommended to use Cytoscape or a browser to visualize the network in order to inspect all node labels. We can also export the network into a PDF file within Cytoscape, and then edit the labels using Adobe Illustrator for publication purposes. To switch off all labels, delete the "Label" mapping under the "Style" tab within Cytoscape, and then export the network view.
Figure 2. Network of enriched terms: (a) colored by cluster ID, where nodes that share the same cluster ID are typically close to each other; (b) colored by p-value, where terms containing more genes tend to have a more significant p-value.
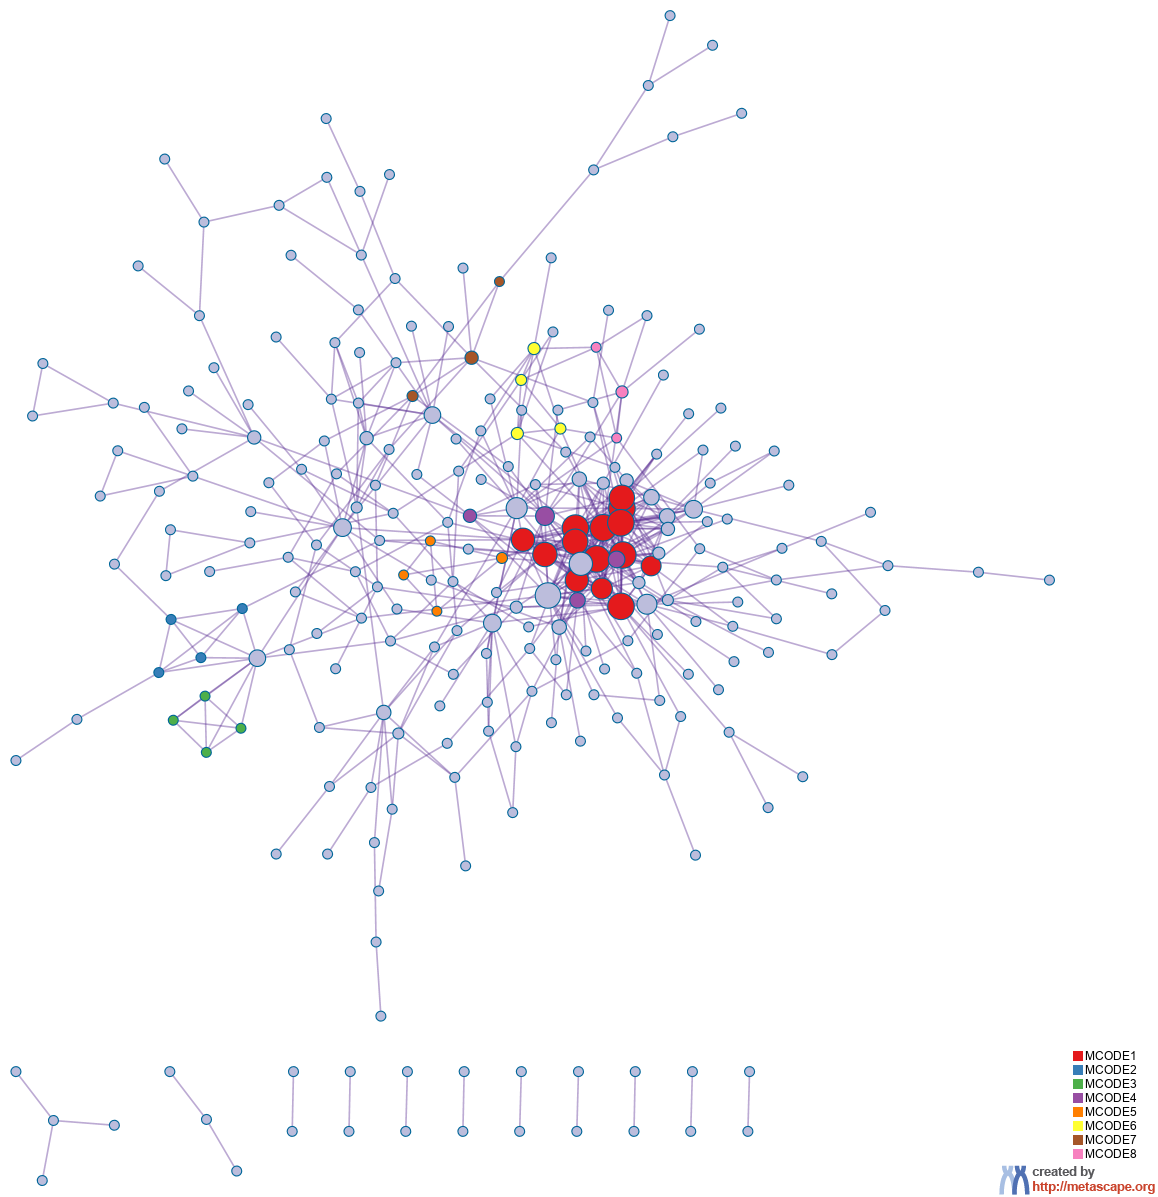
Protein-protein Interaction Enrichment Analysis
For each given gene list, protein-protein interaction enrichment analysis has been carried out with the following databases: BioGrid
6, InWeb_IM
7, OmniPath
8. The resultant network contains the subset of proteins that form physical interactions with at least one other member in the list. If the network contains between 3 and 500 proteins, the Molecular Complex Detection (MCODE) algorithm
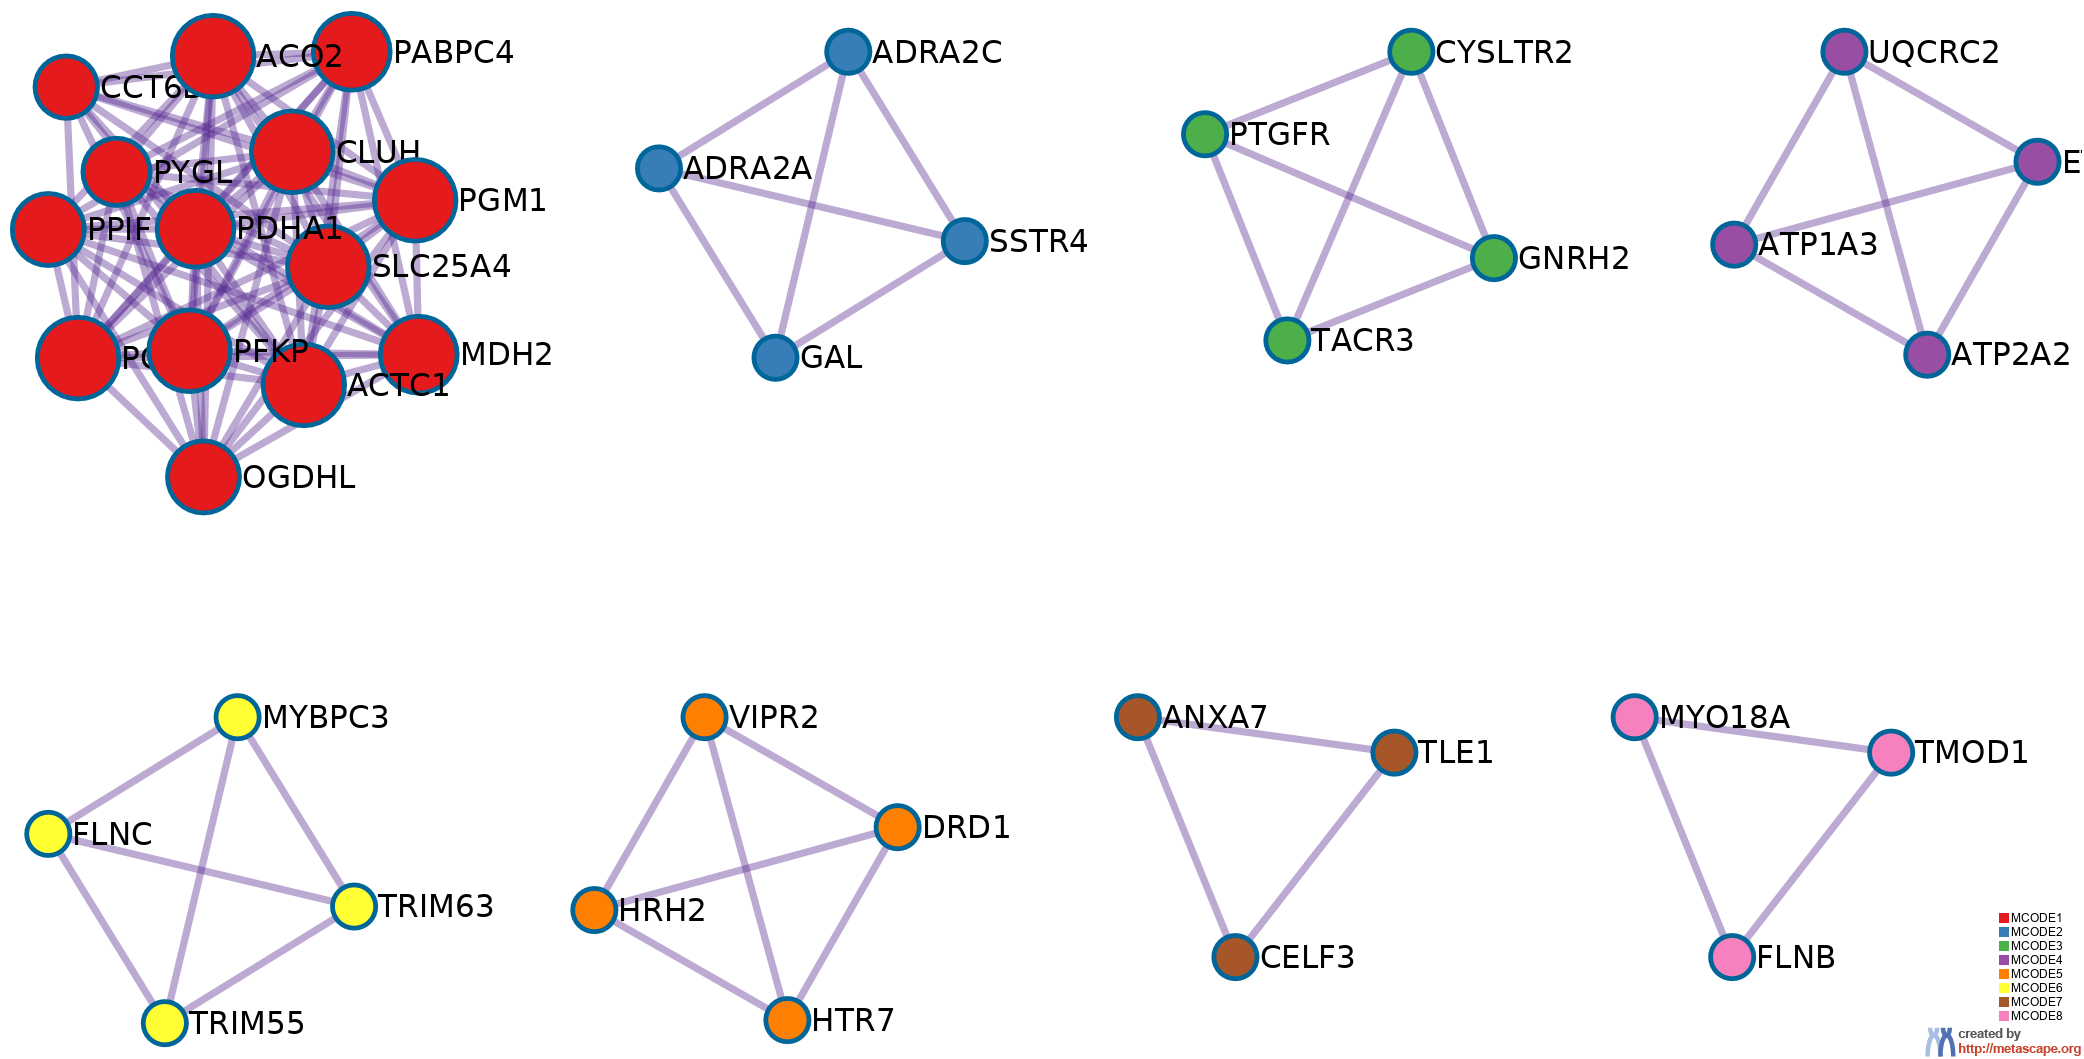
9 has been applied to identify densely connected network components. The MCODE networks identified for individual gene lists have been gathered and are shown in Figure 3.
Pathway and process enrichment analysis has been applied to each MCODE component independently, and the three best-scoring terms by p-value have been retained as the functional description of the corresponding components, shown in the tables underneath corresponding network plots within Figure 3.
Figure 3. Protein-protein interaction network and MCODE components identified in the gene lists.
 | |  |


| |
|
| GO |
Description |
Log10(P) |
| GO:0003012 |
muscle system process |
-13.8 |
| GO:0006936 |
muscle contraction |
-13.0 |
| GO:0043269 |
regulation of ion transport |
-12.2 |
| |
| Color |
MCODE |
GO |
Description |
Log10(P) |
|
MCODE_1 |
GO:0006091 |
generation of precursor metabolites and energy |
-11.8 |
|
MCODE_1 |
GO:0006099 |
tricarboxylic acid cycle |
-8.5 |
|
MCODE_1 |
GO:0006101 |
citrate metabolic process |
-8.4 |
|
MCODE_2 |
GO:0019933 |
cAMP-mediated signaling |
-8.5 |
|
MCODE_2 |
GO:0019935 |
cyclic-nucleotide-mediated signaling |
-8.2 |
|
MCODE_2 |
GO:0019932 |
second-messenger-mediated signaling |
-6.9 |
|
MCODE_5 |
GO:0008227 |
G protein-coupled amine receptor activity |
-7.2 |
|
MCODE_5 |
GO:0030594 |
neurotransmitter receptor activity |
-6.4 |
|
MCODE_5 |
GO:0035296 |
regulation of tube diameter |
-6.1 |
|
MCODE_6 |
C0878544 |
Cardiomyopathies |
-6.4 |
|
MCODE_6 |
GO:0030017 |
sarcomere |
-5.6 |
|
MCODE_6 |
GO:0044449 |
contractile fiber part |
-5.5 |
|
MCODE_8 |
GO:0003779 |
actin binding |
-5.2 |
|
MCODE_8 |
GO:0015629 |
actin cytoskeleton |
-5.0 |
|
MCODE_8 |
GO:0030036 |
actin cytoskeleton organization |
-4.6 |
|
Gene Prioritization by Evidence Counting (GPEC) (beta feature)
GPEC is an effective way to identify a subset of genes that are more likely to be of higher quality hits. As we are still working on a GPEC publication, please be advised of the risk when using GPEC analysis results. A gene receives an evidence token whenever it is identified as a hit within an input gene list, falls into at least one enriched pathway (pathway size is no more than 100) derived from an input gene list, or is part of the protein-protein interaction network formed by a given input gene list. The evidence count of a gene is the total number of evidence token it receives. Given n input gene lists, the maximum possible evidence count is 3n. Our research suggests that the likelihood of a gene being a true biological hit increases as its total evidence count increases. Therefore, all input genes can be ranked in descending order by their evidence counts, and then various evidence count cutoffs can be applied to generate new gene lists of varying quality. Shorter gene lists containing the most of the top-ranked genes are of higher quality (i.e., higher precision and lower false discovery rate), and longer gene lists obtained under relaxed cutoffs are more comphrehesive (i.e., higher recall and sensitivity). Term enrichment analysis is carried out for different cutoffs, and the best p-value per term is retained. For protein network analysis, an evidence cutoff that yields a _FINAL network of approximately 250 protein nodes is selected, so that the network remains rich yet visually interpretable. Conceptually, the processes and network components identified by the GPEC algorithm is more robust, as it is based on the subset of genes that have higher evidence counts, compared to relying on the list in which all gene lists are merged into one. Additional information regarding GPEC can be found on the menu page.
Reference
- Zhou et al., Metascape provides a biologist-oriented resource for the analysis of systems-level datasets. Nature Communications (2019) 10(1):1523.
- Zar, J.H. Biostatistical Analysis 1999 4th edn., NJ Prentice Hall, pp. 523
- Hochberg Y., Benjamini Y. More powerful procedures for multiple significance testing. Statistics in Medicine (1990) 9:811-818.
- Cohen, J. A coefficient of agreement for nominal scales. Educ. Psychol. Meas. (1960) 20:27-46.
- Shannon P. et al., Cytoscape: a software environment for integrated models of biomolecular interaction networks. Genome Res (2003) 11:2498-2504.
- Stark C. et al. BioGRID: a general repository for interaction datasets. Nucleic Acids Res. (2006) 34:D535-539.
- Li T. et al. A scored human protein-protein interaction network to catalyze genomic interpretation. Nat. Methods. (2017) 14:61-64.
- Turei D. et al. A scored human protein-protein interaction network to catalyze genomic interpretation. Nat. Methods. (2016) 13:966-967.
- Bader, G.D. et al. An automated method for finding molecular complexes in large protein interaction networks. BMC bioinformatics (2003) 4:2.